RapDev's Influx DB Integration

August 18, 2022
|
3
min read

InfluxDB has established a solid foothold in the self-hosted monitoring space in the past few years. It’s a scalable, extendable, and user-friendly open source time series datastore that is capable of storing data with granularity down to nanoseconds. And, if you’re working with data that needs that kind of granularity, you’re not going to find many other tools that can handle that kind of resolution, so having a facility like InfluxDB is critical to some organizations. 

That said, if it’s critical, you need to know how it’s working, but what will monitor the monitoring software? Self monitoring is an anti-pattern; if the platform goes down, you’ll never know! RapDev understands how critical it can be to ensure data sources like InfluxDB are alive and well, so we wrote an integration for Datadog that reports data from the InfluxDB Prometheus exporter and sends it out to Datadog. 

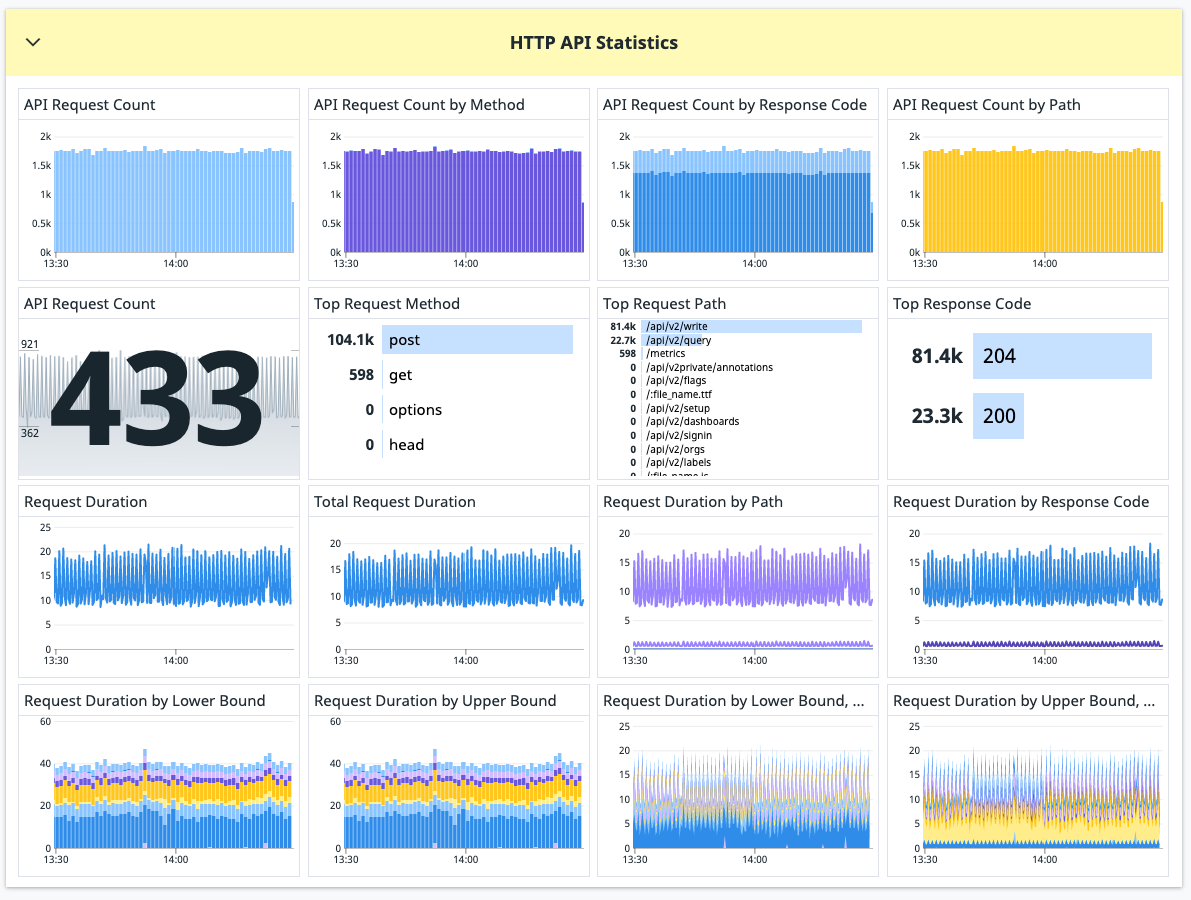
Use the InfluxDB integration monitor vital statistics like API response times and codes

Visualize the usage of the internal InfluxDB facilities

And ensure that the InfluxDB application itself is performant at the Go level

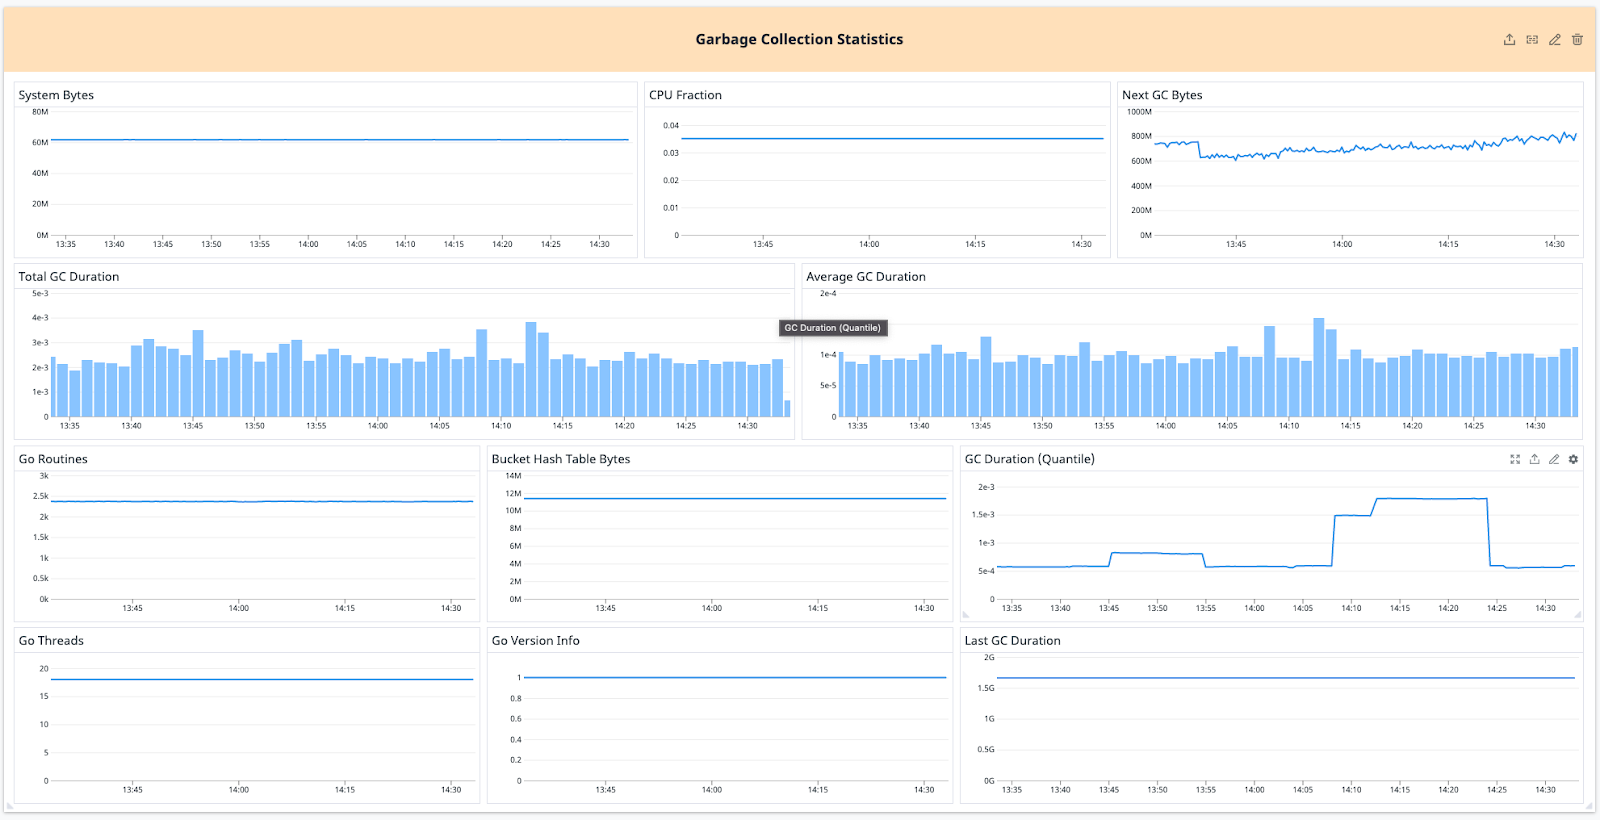
We’ve packaged up dashboards to visualize the System, API, Tasks and Services, and a Summary, so once you get the integration installed, you can have awareness around the system immediately.

Lorem ipsum dolor sit amet, consectetur adipiscing elit. Suspendisse varius enim in eros elementum tristique. Duis cursus, mi quis viverra ornare, eros dolor interdum nulla, ut commodo diam libero vitae erat. Aenean faucibus nibh et justo cursus id rutrum lorem imperdiet. Nunc ut sem vitae risus tristique posuere.

(function execute(inputs, outputs) {
  
  var counter = 0;
  var hrs = inputs.hours;
  var i = 0;
  while (counter < hrs){
    
    var cr = new GlideRecord('change_request');
    cr.get('sys_id', inputs.change.sys_id);
    
    var conflictDetector = new ChangeCheckConflicts(cr);
    var conflictResults = conflictDetector.check();
    gs.info('results ' + conflictResults);
    if(conflictResults > 0){
      var conflict = new GlideRecord('conflict');
      conflict.addQuery('change', inputs.change.sys_id);
      var conflictOr = conflict.addQuery('type', 'blackout');
      conflictOr.addOrCondition('type', 'not_in_maintenance_window');
      conflict.query();
      if (conflict.hasNext()){
        var startgdt = new GlideDateTime(cr.getValue('start_date'));
        var endgdt = new GlideDateTime(cr.getValue('end_date'));
        var chgstart = startgdt.addSeconds(3600);
        var chgend = endgdt.addSeconds(3600);
        cr.start_date.setValue(startgdt);
        cr.end_date.setValue(endgdt);
        cr.autoSysFields(false);
        cr.setWorkflow(false);
        cr.update();
        i++;
        counter ++;
      } else {
        outputs.truestart = cr.start_date;
        return;
      }
    } else {
    outputs.truestart = cr.start_date;
    return;
    }
  } 
    
  conflictDetector = new ChangeCheckConflicts(cr);
  conflictResults = conflictDetector.check();
  if(conflictResults > 0){
    conflict = new GlideRecord('conflict');
    conflict.addQuery('change', inputs.change.sys_id);
    conflictOr = conflict.addQuery('type', 'blackout');
    conflictOr.addOrCondition('type', 'not_in_maintenance_window');
    conflict.query();
    if (conflict.hasNext()){
      outputs.end = true;
    } else {
      outputs.truestart = cr.start_date;
    }
  }
      
})(inputs, outputs);
written by
Nick Vecellio
Nick Vecellio
New England
By day, a DevOps Architect specializing in Kubernetes, cloud infrastructure, logging, and monitoring. By night, a woodworker, punk musician, and dog dad.
Back to main Blog